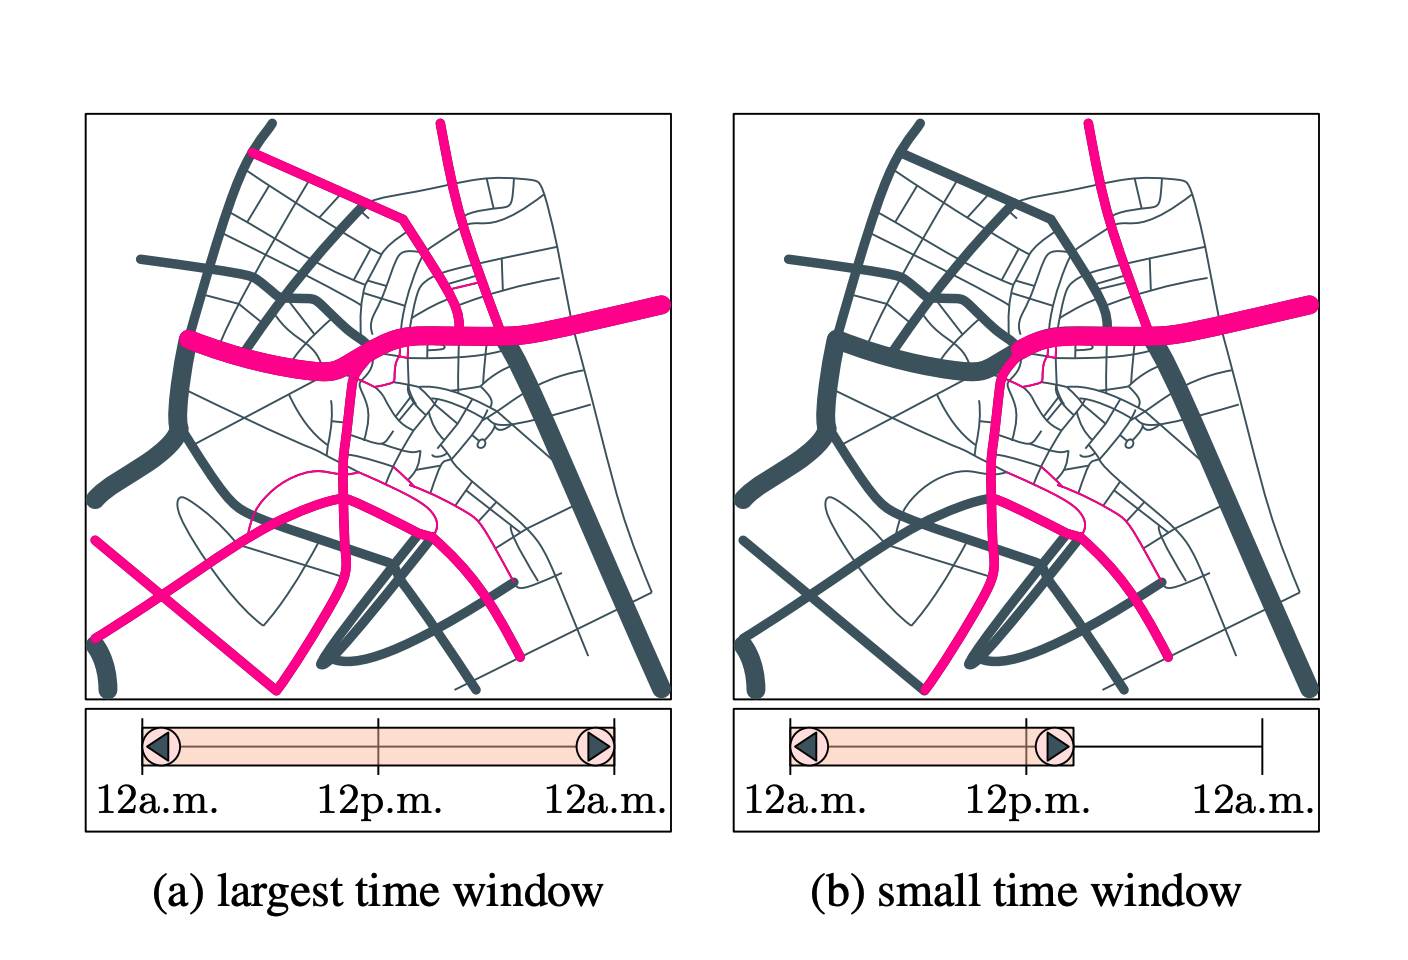
In this work, we provide such an interface where users can filter the data for time windows. When a user queries for a certain time window, we display all network segments that are traversed by at least θ means of public transportation, e.g., buses in the time window on the map. This gives insights into the frequency of the public transit service. Since such transportation networks can contain a high number of network segments, testing each network segment at the moment when the user specifies the time-window query is not fast enough. We investigate an approach to provide the query result in real time. Our contribution is a data structure that answers such arbitrary time-window queries from the user interface. The data structure is based on a tree structure which is augmented with further information. To evaluate our data structure, we perform experiments on real-world data. With our data structure, we answer time-window queries in at most 25 milliseconds whereas testing each network segment on-demand takes at least 60 milliseconds for the data set that has 102599 road segments.
An Efficient Data Structure Providing Maps of the Frequency of Public Transit Service Within User-Specified Time Windows Annika Bonerath, Yu Dong and Jan-Henrik Haunert
Annika Bonerath, Yu Dong and Jan-Henrik Haunert
To understand the quality of a public transportation network, map-based visualizations are the first choice. Since the network quality depends on the transportation schedule, the visualization interface should incorporate time.

The public transportation network and the user interface for two time windows. The road segments that are frequently served are drawn in pink. Between (a) and (b) the users have slid the right boundary of the time window.
© Annika Bonerath, Yu Dong, Jan-Henrik Haunert
Alle Bilder in Originalgröße herunterladen
Der Abdruck im Zusammenhang mit der Nachricht ist kostenlos, dabei ist der angegebene Bildautor zu nennen.
https://doi.org/10.5194/ica-adv-4-1-2023
Links
- https://www.igg.uni-bonn.de/geoinfo/de/publikationen/publikationen-nach-jahreszahlen/2023/copy_of_an-efficient-data-structure-providing-maps-of-the-frequency-of-public-transit-service-within-user-specified-time-windows